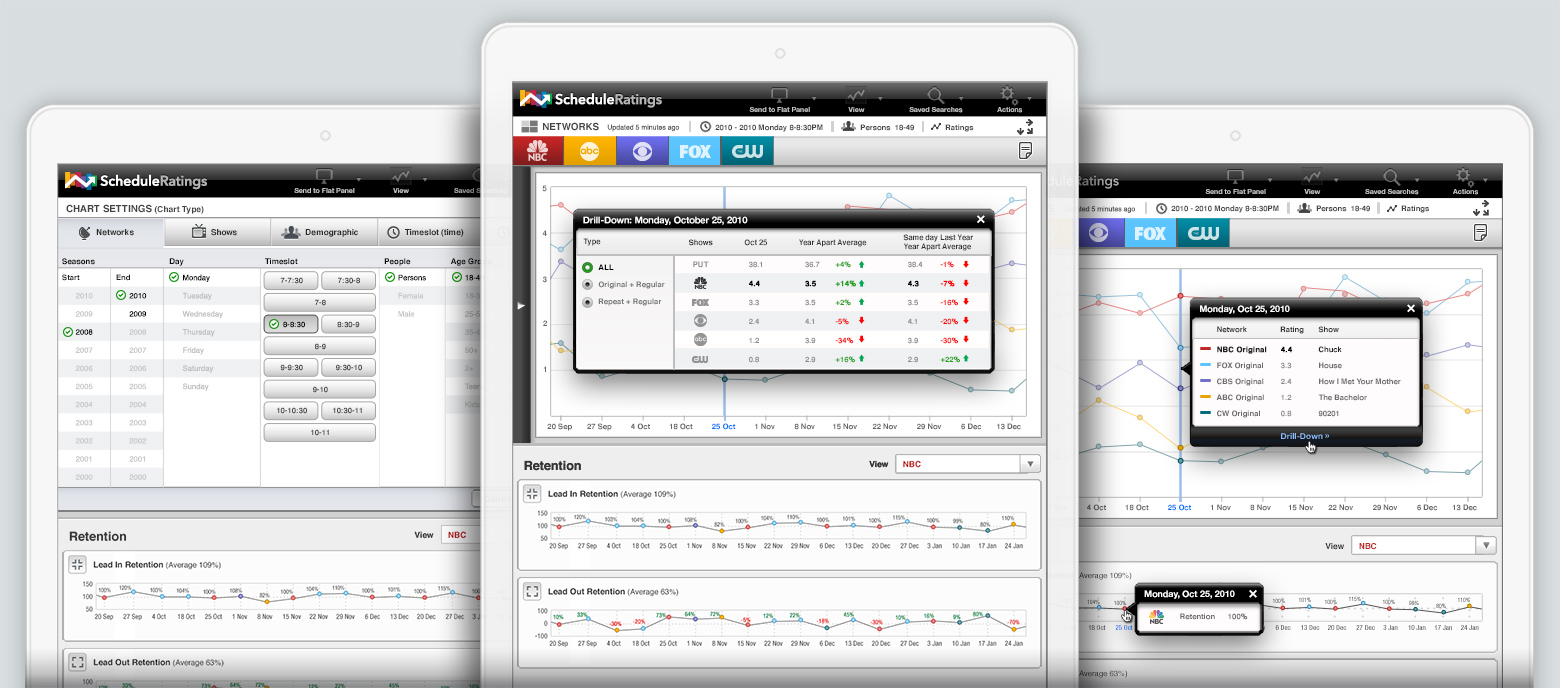
Networks: Single Column Graph
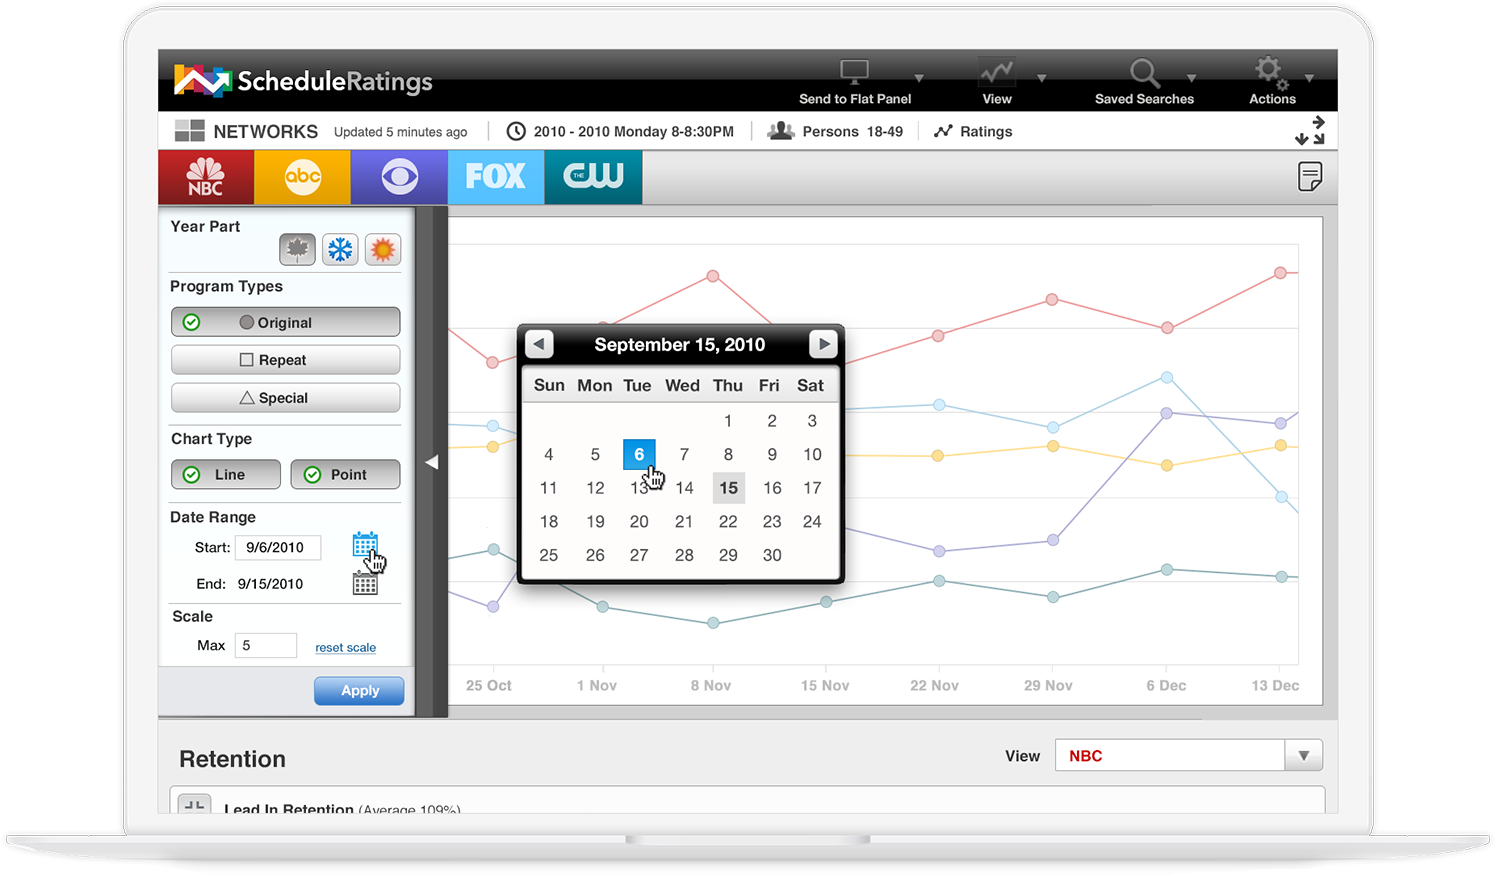
Graph drawer options with date selector

Schedule Ratings is a customizable internal web app built exclusively for NBCU, designed to compare television show and network viewership ratings.
Needs & Requirements
A small group of NBCU senior executives needed a scheduling tool to evaluate past and current ratings data across major broadcast networks and shows. The tool had to offer easy-to-navigate visual comparisons with intuitive touch controls for non-technical users. Portability was also essential (freedom from bulky laptops), allowing easy transport between boardrooms for strategic planning.
Design Solution
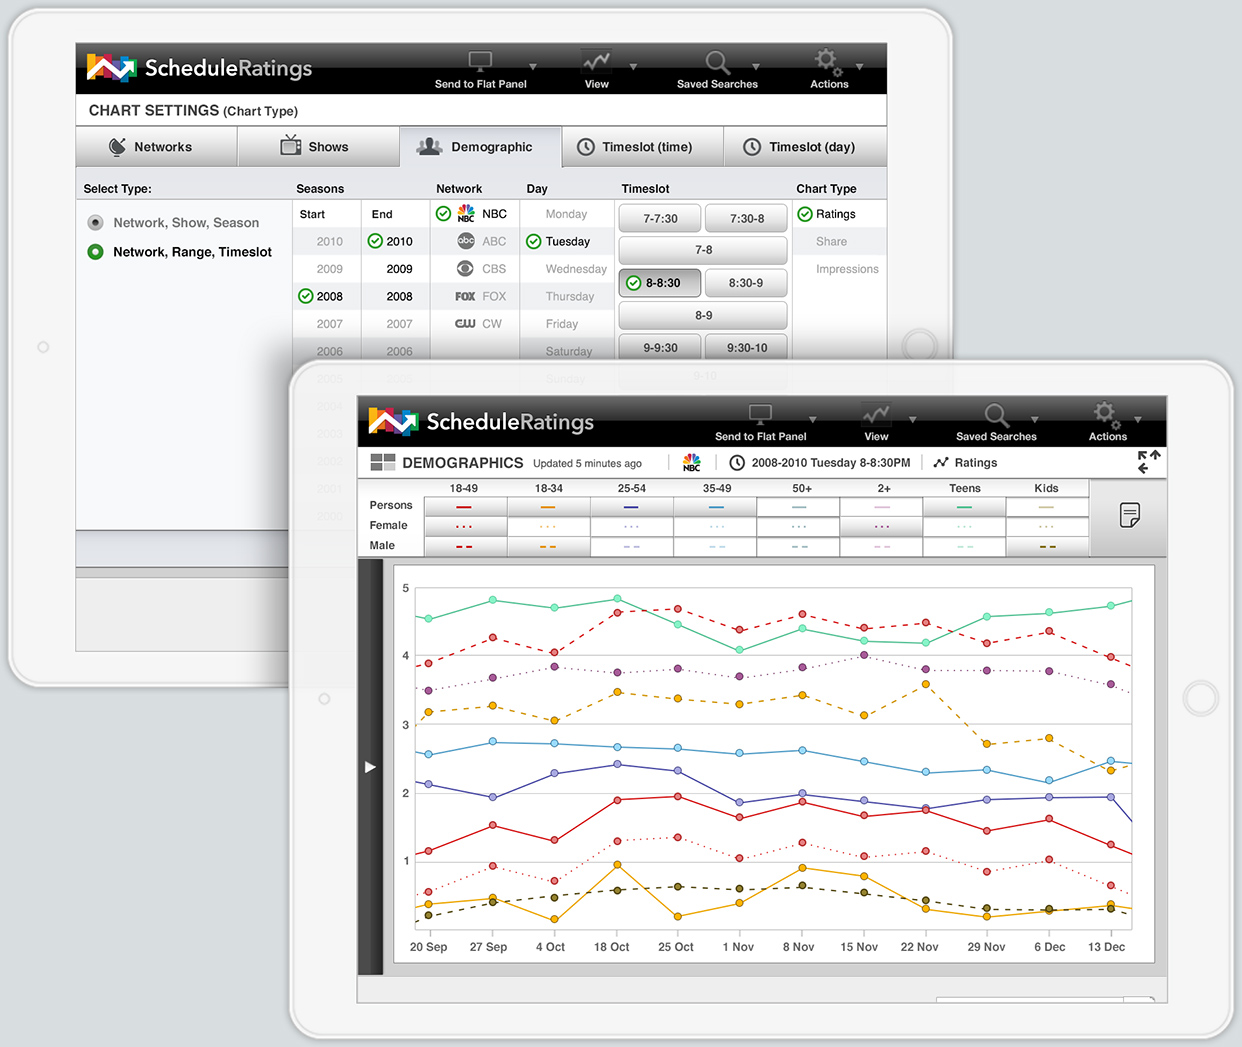
The iPad-based app provides customizable, filterable data views by network, demographic, program, time slot, and season. Multiple visualization modes enable direct comparisons, while drill-down features support deeper long-term performance analysis. For collaborative meetings, the interface scales seamlessly from iPad to conference-room displays, supporting real-time screen sharing and group analysis for programming decisions.
Data-Driven Decisions
By turning raw ratings data into interactive visuals, the tool makes it easy to spot performance patterns, track long-term trends, and shape programming strategy all with the touch of a fingertip.